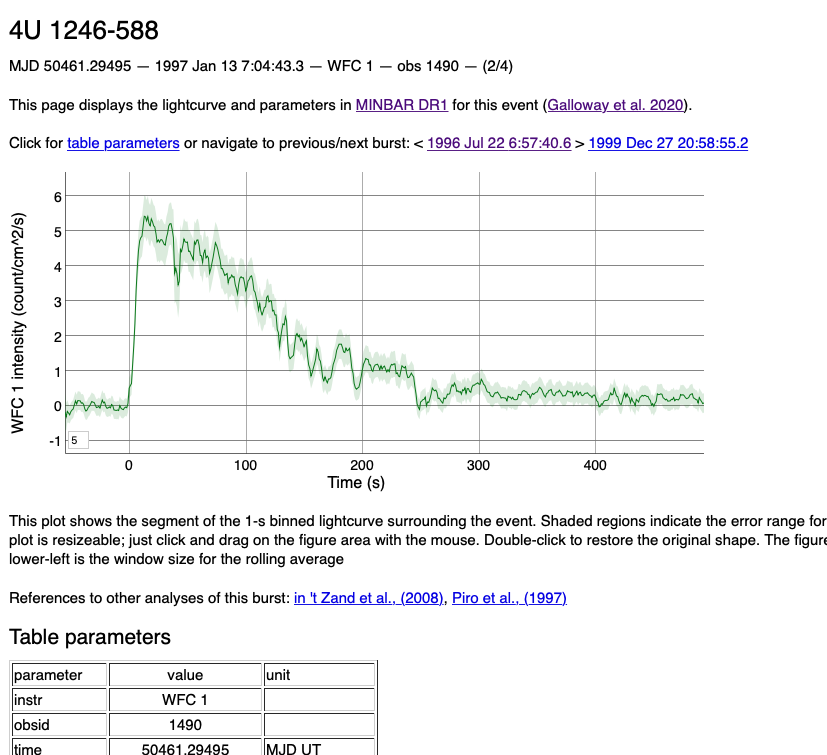
MINBAR burst interface visualisation
 The web interface to the MINBAR
burst sample is the result of a collaboration with the
Monash
eResearch Centre. The interface offers data selection and filtering tools,
as well as output as ASCII for offline analysis and basic plotting.
We'd always envisaged offering more visualisation capabilities, but had not managed to implement them, until now. When you search the burst interface, you'll see a "wiki" link for each entry. Clicking on this link will bring up a page listing all the analysis results for this event, along with a dynamic plot of the burst lightcurve, and link to the time-resolved spectroscopy (where available). Click here (#2582) for a beautiful example from GX 17+2.
The same lightcurve files are now also accessible via the Python repository, using the get_lc method. We're also working on a method to return the time-resolved spectroscopy.
Labels: 2021, /thermonuclear bursts


